hicPlotMatrix
Creates a Heatmap of a HiC matrix.
usage: hicPlotMatrix --matrix MATRIX --outFileName OUTFILENAME [--title TITLE]
                     [--scoreName SCORENAME] [--perChromosome]
                     [--clearMaskedBins]
                     [--chromosomeOrder CHROMOSOMEORDER [CHROMOSOMEORDER ...]]
                     [--region REGION] [--region2 REGION2] [--log1p] [--log]
                     [--colorMap COLORMAP] [--vMin VMIN] [--vMax VMAX]
                     [--dpi DPI] [--bigwig BIGWIG] [--flipBigwigSign]
                     [--scaleFactorBigwig SCALEFACTORBIGWIG] [--help]
                     [--version]
Required arguments
| –matrix, -m | Path of the Hi-C matrix to plot. |
| –outFileName, -out | |
| File name to save the image. | |
Optional arguments
| –title, -t | Plot title. |
| –scoreName, -s | |
| Score name. | |
| –perChromosome | |
Instead of plotting the whole matrix, each chromosome is plotted next to the other. This parameter is not compatible with –region. Default: False | |
| –clearMaskedBins | |
If set, masked bins are removed from the matrix and not shown as black lines. Default: False | |
| –chromosomeOrder | |
| Chromosomes and order in which the chromosomes should be plotted. This option overrides –region and –region2. | |
| –region | Plot only this region. The format is chr:start-end The plotted region contains the main diagonal and is symmetric unless –region2 is given. |
| –region2 | If given, then only the region defined by –region and –region2 is given. The format is the same as –region1. |
| –log1p | Plot the log1p of the matrix values. Default: False |
| –log | Plot the MINUS log of the matrix values. Default: False |
| –colorMap | Color map to use for the heatmap. Available values can be seen here: http://matplotlib.org/examples/color/colormaps_reference.html Default: “RdYlBu_r” |
| –vMin | Minimum score value. |
| –vMax | Maximum score value. |
| –dpi | Resolution for the image in case theouput is a raster graphics image (e.g png, jpg). Default: 72 |
| –bigwig | Bigwig file to plot below the matrix. This can for example be used to visualize A/B compartments or ChIP-seq data. |
| –flipBigwigSign | |
The sign of the bigwig values are flipped. Useful if hicPCA gives inverted values. Default: False | |
| –scaleFactorBigwig | |
Scale the values of a bigwig file by the given factor. Default: 1.0 | |
| –version | show program’s version number and exit |
Details
hicplotMatrix takes a Hi-C matrix and plots the interactions of all or some chromosomes.
Examples
Here’s an example of Hi-C data from wild-type D. melanogaster embryos.
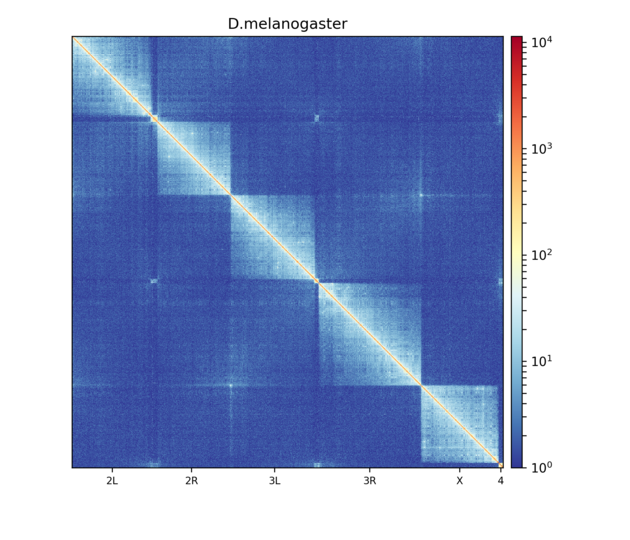
This plot shows contacts of a Hi-C matrix that was merged to a 25 kb bin size using hicMergeMatrixBins. Alternatively, chromosomes can be plotted separately.
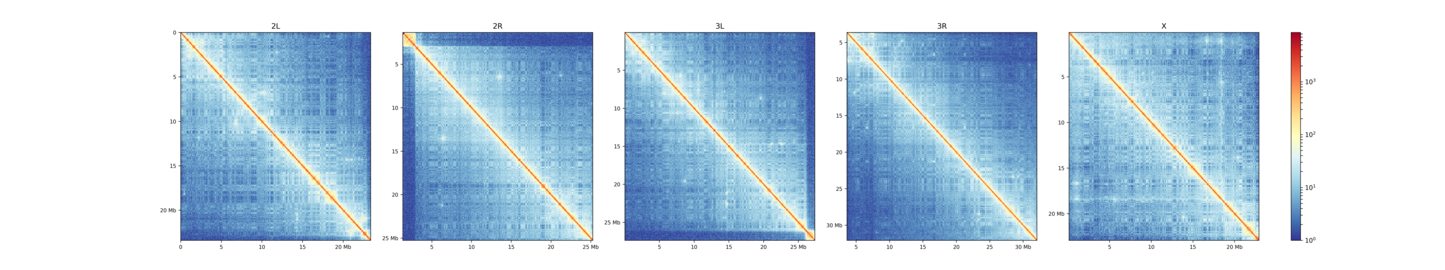
$ hicPlotMatrix -m Dmel.h5 -o hicPlotMatrix.png \
-t 'D.melanogaster (--perChromosome)' --log1p \
--clearMaskedBins --chromosomeOrder 2L 2R 3L 3R X --perChromosome